Tap into visual insights for quick and effective understanding
ATS infographics distill complex IT concepts into easy-to-understand visual formats. Designed to provide quick, clear insights, these infographics cover a wide range of topics from cybersecurity to cloud solutions. Each graphic is meticulously crafted to help you grasp essential information at a glance, making it easier to understand trends, data, and technical details. Explore our collection to enhance your knowledge and make informed decisions with the power of visual learning.
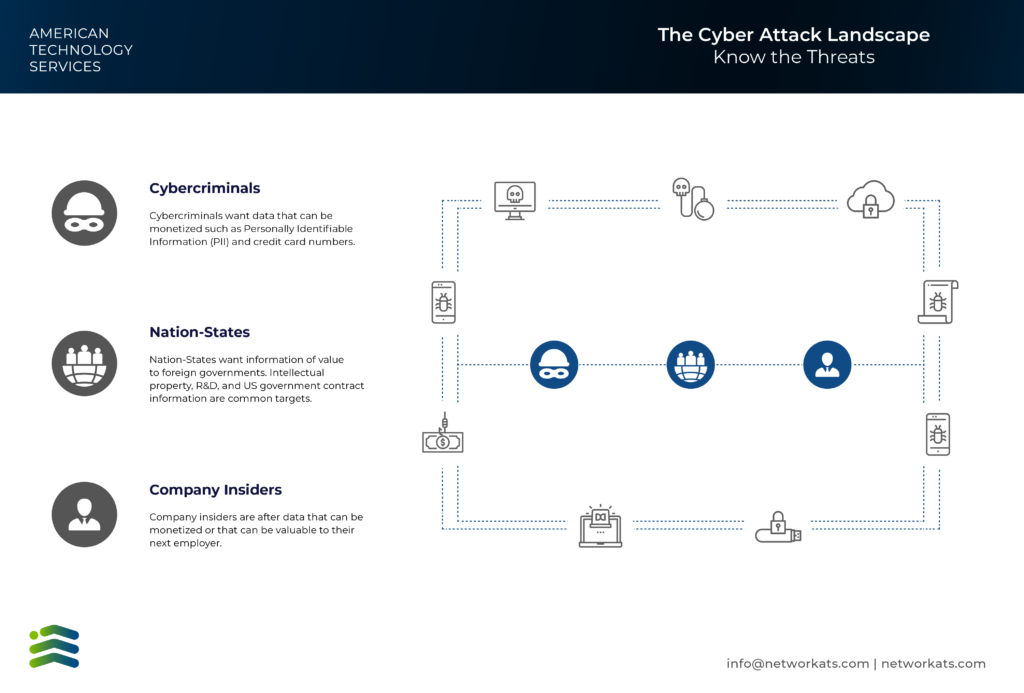
Cyber Threats: Who’s Targeting Your Organization
Cybercriminals, nation-states, and insiders each pursue different types of valuable data. This infographic highlights the motivations and methods behind modern cyberattacks.
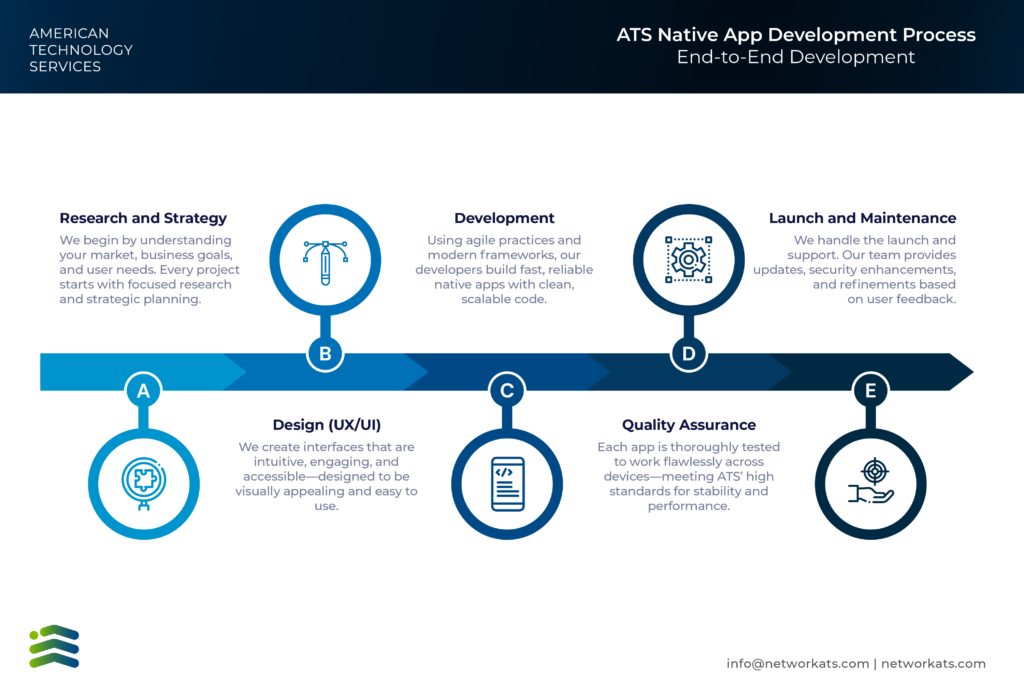
Native App Development at ATS: A Full-Cycle Process
From research to launch, ATS builds fast, intuitive apps backed by strategy and scalable code. This visual breaks down each phase of our native app development.
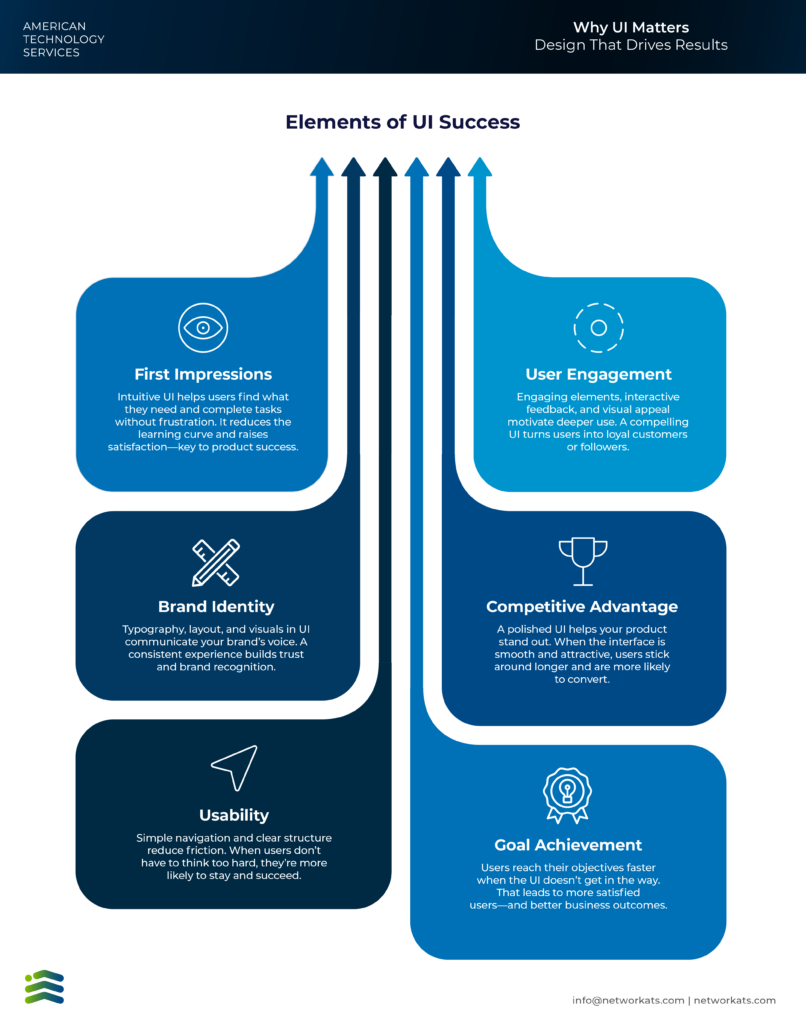
Good UI is more than visual polish—it influences engagement, trust, and outcomes. This infographic shows the key elements that turn interfaces into conversion tools.